Are Benefits From Agricultural Intensification Related to Household Income, Level of Education and Gender?

This analysis is a result of the collaboration between the eScience Institute Data Science for Social Good Program and Vital Signs. Learn more about this program here.
In developing countries, agricultural intensification (defined as increased input per unit of land) is a key phenomenon of interest. These inputs may include land, fertilizers, pesticides and labor including use of agricultural machinery. Increasing agricultural intensification can contribute to aggregate-level increases in food availability and economic performance. However, these benefits may not be evenly distributed, largely based on unequal access to key inputs, either across landscapes or countries or according to some demographic feature of interest.
For the purposes of this study, we focus on investigating gender- and income-based equity outcomes as they relate to availability and usage of agricultural inputs. Previous studies[1] examining the relationship between gender and input usage have returned mixed results. For example, this study found organic fertilizer usage is substantially higher in male-headed households than female-headed households. By contrast, usage of improved fallows is largely unrelated to the gender of the household head. Here, we extend this investigation across an array of agricultural intensification indicators and examine how usage of these inputs varies by gender and country in the Vital Signs dataset. We conclude by examining the relationship between input usage and landscape-level income and education equity outcomes.
Previous studies[2], in their analysis of indicators of agricultural intensification, identified nitrogen fertilizers, measurement of crop yields, pesticide use, farming systems, labor intensity and technologies among others as measures on intensification. For the purposes of this study, we focus largely on agricultural and labor inputs. In particular, we examine differences in fertilizer usage (inorganic and organic, measured by purchase price and kilograms used), pesticide/herbicide usage (measured by purchase price), and usage of hired labor (measured by total cost of hired labor and person-days used). We also include within-field intercropping rate as a further intensification indicator.
Organic and Non-organic Fertilizer Usage
Examining fertilizer usage indicates that total input usage varies substantially by landscape and country. For example, a substantially greater proportion of households in Ghana, Rwanda and Tanzania report using inorganic fertilizer than in Uganda. However, there is also substantial within-country variation. For example, within Rwanda, nearly 75 percent of households in the Volcanoes and Nyungwe regions report using inorganic fertilizer, compared with none in the Akagera region. At least in Rwanda, this pattern largely matches results from the Vital Signs qualitative households’ descriptions, which identify Volcanoes and Nyungwe as productive, cash-oriented agricultural regions.

By contrast, organic fertilizer usage is much higher in Rwanda than other regions. This difference is likely attributable to high rates of livestock ownership in Rwanda, which provide an easy source of organic fertilizer to most households.

Pesticide and Herbicide Use
As regards pesticide and herbicide use, Ghana reports a substantially higher proportion of use compared to other Vital Signs countries. This pattern largely matches the findings from the previous set of indicators, which return similar results for most landscapes.

Hiring Outside Labor
Non-household labor usage rates form a similar pattern, with a substantially larger proportion of Ghanaian households reporting at least some outside labor usage. The landscapes outside of Ghana that report high rates of non-household labor usage are largely consistent with their counterparts on previous indicators, including Volcanoes and Gishwati in Rwanda and Masindi in Uganda.
Intercropping Rates
In our analysis, we found that on average, Ghanaian landscapes exhibited the lowest intercropping rates, maintaining the pattern from previous indicators. However, all countries show substantial variation on this indicator. Comparing this variation in intercropping rates seems at least loosely related to landscape level Vital Signs qualitative characteristics. For example, the Masindi landscape in Uganda is identified as one of the most mechanized and commercialized regions in the country and also displays the lowest intercropping rates in the country. The Volcanoes landscape in Rwanda is identified as being similarly productive and exhibits similarly low intercropping rates. However, this relationship is not completely consistent; for example, the Sumbawanga landscape in Tanzania is identified as a relatively intensified region but appears to exhibit one of highest intercropping rates. Monoculture is a key indicator of agricultural intensification, making intercropping prevalence particularly worthy of investigation. For example, the study by Martinez et al (2015) found that monoculture systems with specialized cropping and high levels of pesticide use were found to be more intensified.

Agricultural Intensification and Inequality
Disaggregating the above agricultural intensification indicators (Fig. 5) by gender indicates that male- and female-headed households report approximately equal values for the indicators intercropping, pesticide, herbicide and organic fertilizer usage. A greater proportion of female-headed households, however, report using inorganic fertilizer and non-household labor, suggesting that these households are more likely to follow intensified agricultural practices. Male-headed households also own approximately double the land that female-headed households report (0.98 hectares/household vs 2.35 hectares/household), so inputs used for male-headed households are much larger than their female-headed counterparts in most cases. Examining agricultural input usage between countries indicate that female-headed households report more inorganic fertilizer use in Ghana and Tanzania with male headed households reporting slightly higher usage in Rwanda and Uganda.

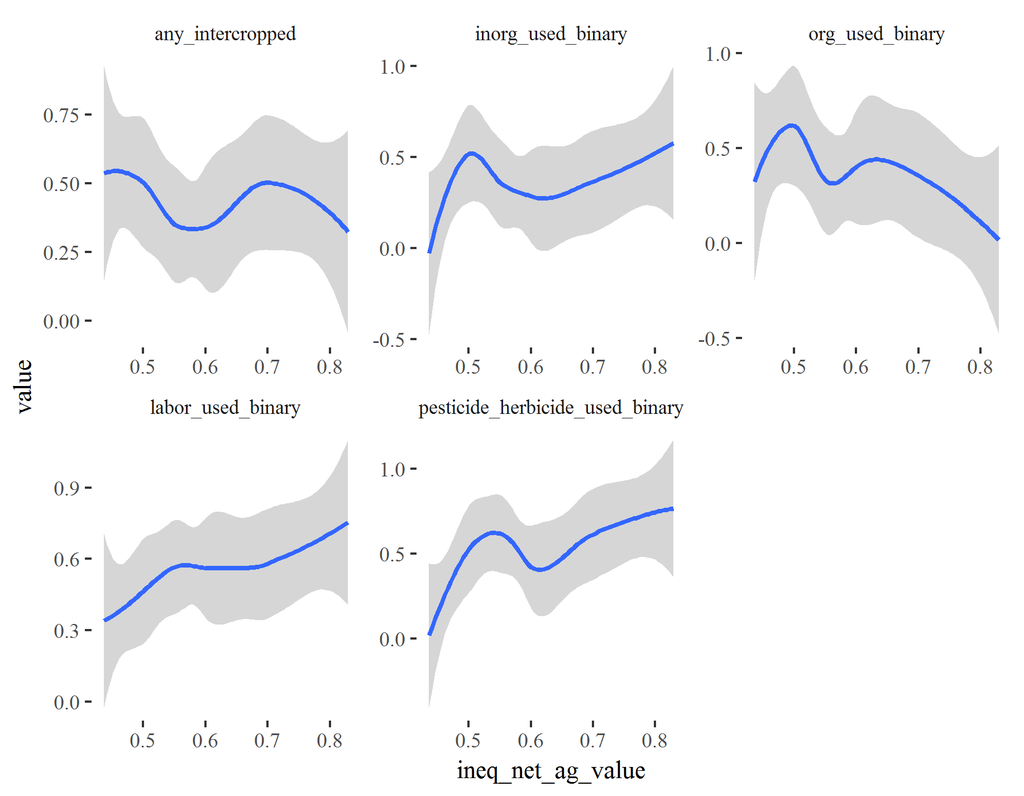
Finally, we examined whether the benefits of agricultural intensification as measured using the various indicators constructed above were evenly distributed within Vital Signs Landscapes. We particularly focused on distribution of household income and education benefits. The results showed that landscapes with a higher proportion of households reporting fertilizer usage, intercropping, non-household labor and pesticide usage do not appear to be more unequal (as measured by a Gini coefficient calculated on net value of agricultural goods produced) than their less-intensified counterparts. A Gini coefficient of zero expresses perfect equality, where all values are the same (for example, where everyone has the same income).
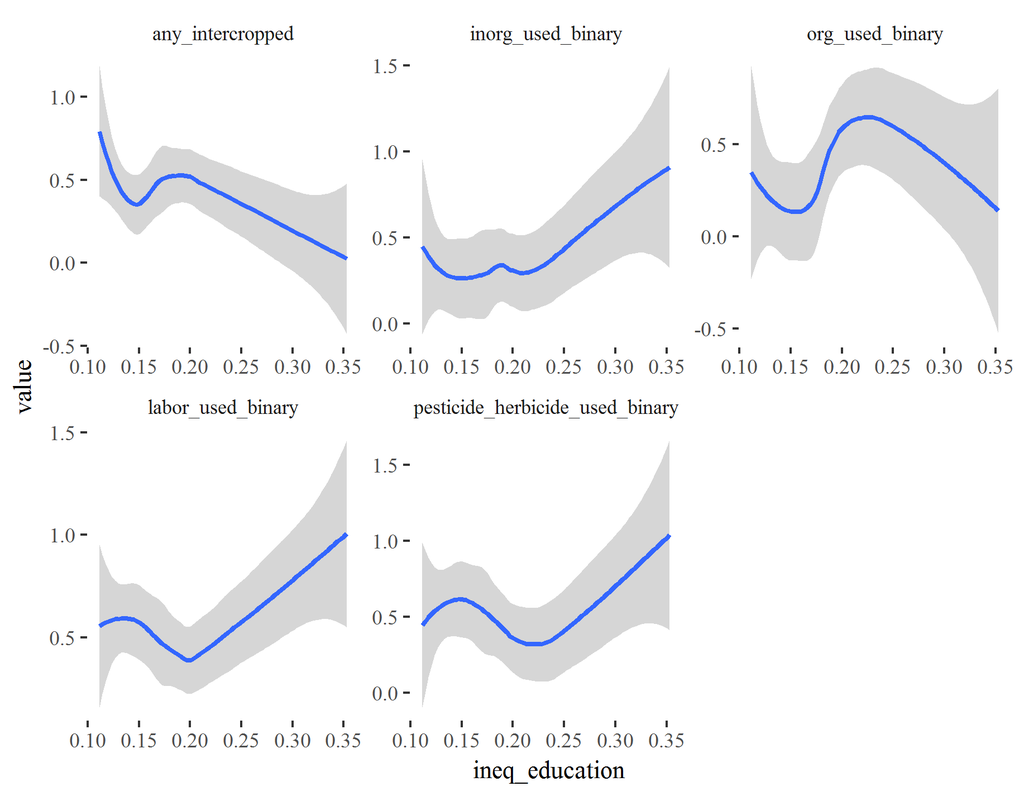
Looking at the distribution of education benefits between more and less intensified landscapes, the same story holds, where high inequality landscapes with a small number of highly educated people and a larger number of low-education people are somewhat more likely to use inorganic fertilizer, labor and pesticides.
Conclusion
Based on the results, it does not appear that greater access to intensification-related agricultural inputs contributes to inequality as measured by income and education levels. Moreover, it does not appear that female-headed households are any less willing than their male-headed counterparts to adopt various inputs and agricultural practices associated with intensified farming. Rather, differences between household uses of agricultural inputs are largely attributable to existing differences in household wealth (as measured by land ownership). Overall, there is need to further close the gender gap for various agricultural assets in particular access to land, labor and inorganic fertilizers if the benefits to agricultural intensification are to remain evenly distributed between households.
Agricultural intensification and its associated benefits are more complex than this summary analysis can provide. Further analysis and observations is therefore needed to build on the above findings.
[1] Phiri, Donald & Franzel, Steven & Mafongoya, Paramu & Jere, Isaac & Katanga, Roza & Phiri, Stanslous. "Who is using the new technology? The association of wealth status and gender with the planting of improved tree fallows in Eastern Province, Zambia." Agricultural Systems 79(2004): 131-144
[2] Irune Ruiz-Martinez, Elisa Marraccini, Marta Debolini, Enrico Bonari."Indicators of Agricultural Intensity and Intensification: A Review of the Literature." Italian Journal of Agronomy 10.2(2015): https://doi/10.4081/ija.2015.656